Custom dashboards & BI
Interactive dashboards built for how your team actually reads data — not a generic template.
golang · any data source · olap
n32b designs and ships OLAP analytics systems — dashboards, reports, and data pipelines — pulling from any source you already use, at speed legacy BI stacks can't match.
Dashboards, trend lines, and data tables — the deliverables you actually use, not slideware.
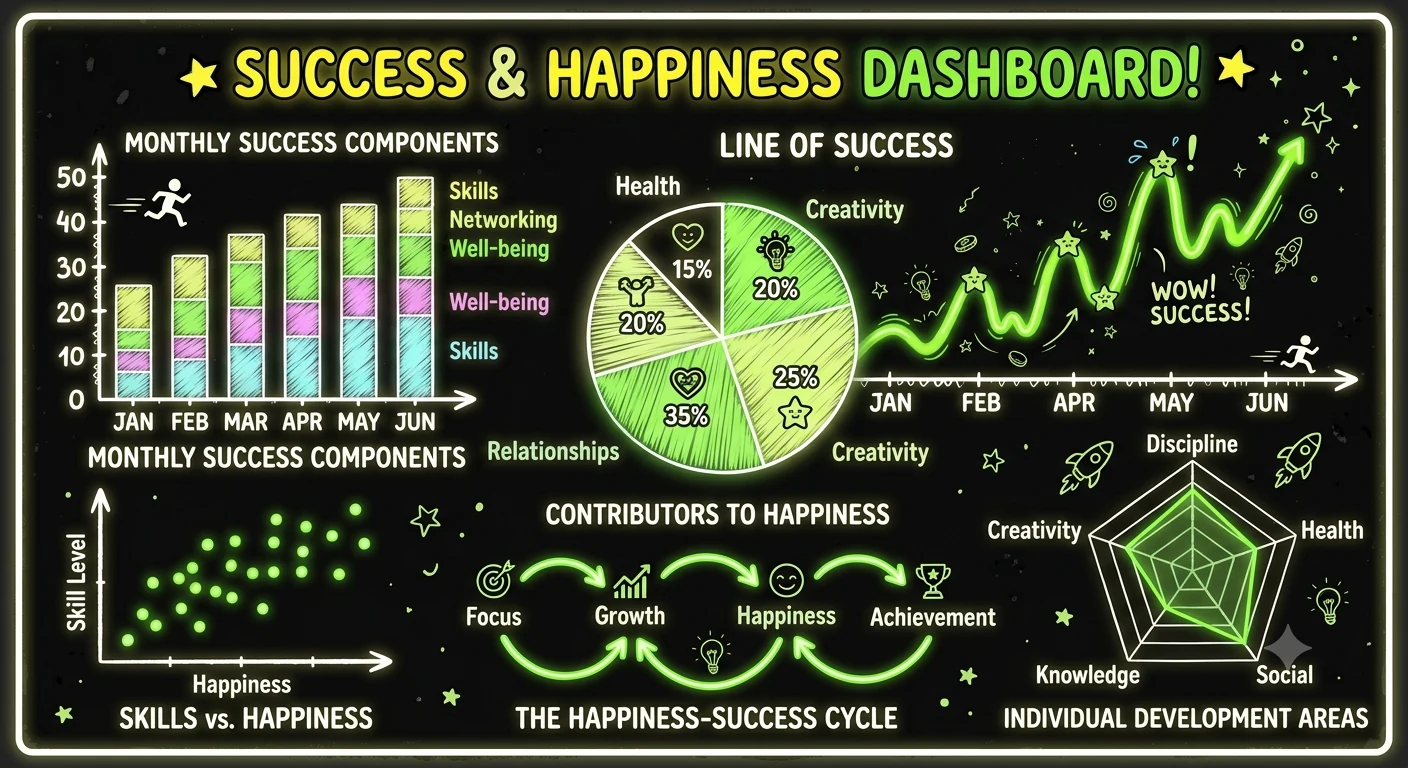
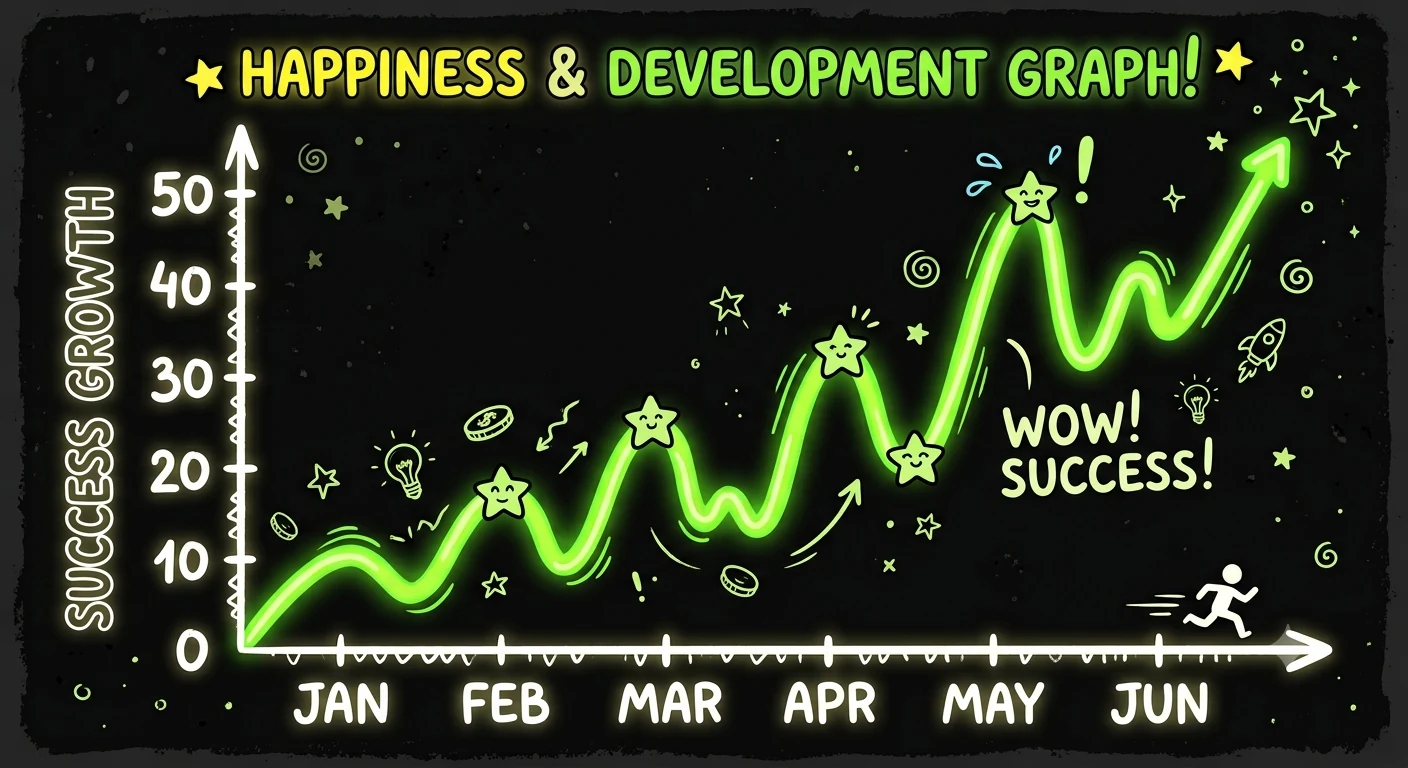
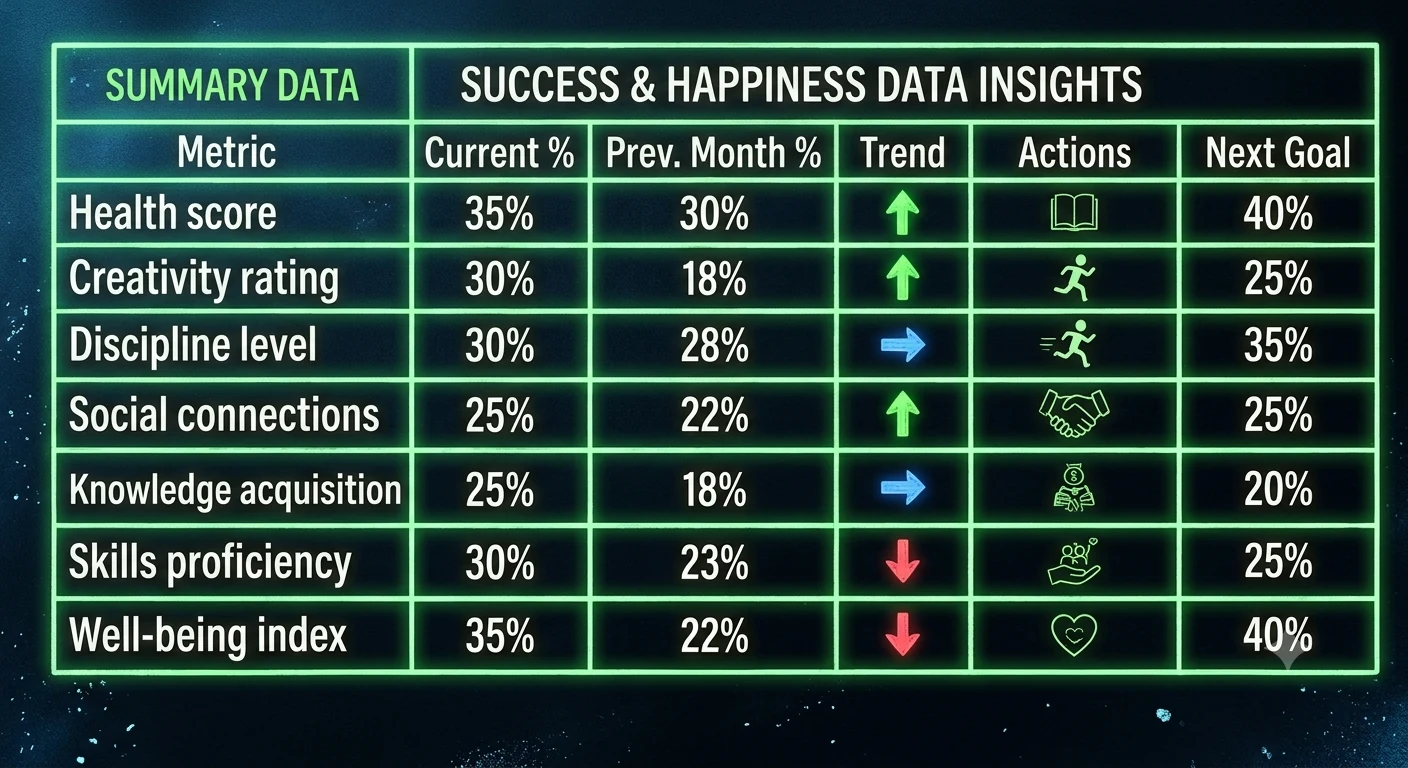
Interactive dashboards built for how your team actually reads data — not a generic template.
Scheduled reports that generate, format, and deliver themselves — no more manual exports.
Reliable scrapers and ingestion jobs that pull, clean, and normalize data from any source, on schedule.
Go-based pipelines that consolidate MySQL, Postgres, Mongo, APIs, and more into DuckDB for analytics that stay fast as data grows.
We collect your data, explore it for quality and coverage, and shape it into a clean, structured dataset ready for fine-tuning.
Always-on analysis of your data — anomaly alerts, ad-campaign optimization, and triggers that fire actions automatically when the numbers move.
We host your data and services, or deploy the full stack on your own hardware — including local LLMs for private, offline data analysis.
MySQL, PostgreSQL, MongoDB, REST APIs, Google Analytics, Google Sheets — whatever you already run on. Go handles ingestion and scheduling; we consolidate everything into one fast analytical layer, so your dashboards stay quick no matter how many systems feed them.
Every dashboard we ship can be paired with a natural-language layer on top of your data — ask a question in plain English, get back SQL, a chart, and an answer. No more waiting on the data team for one-off reports.
We map your data sources, current pain points, and what "done" looks like.
We collect and prepare data from every source — MySQL, PostgreSQL, MongoDB, APIs, Google Analytics, Sheets — into DuckDB for fast analysis.
We design the transformation, storage, and query layer around your actual data volume.
Working dashboards and reports, iterated with you in short cycles.
Documented, maintainable systems — plus ongoing support if you want it.
Tell us what you're working with. We'll tell you how fast we can make it, and what it'll take to ship.